Kitsap Public Health District Exposed!
They are Skewing the Data in Favor of the Vaccine!
Breakthrough Information 10-23-21
Kitsap County is the only county that has this type of convoluted data. It can only be propaganda!
I posted this information on the KPHD Facebook page and they reported me to Facebook and I was banned for 30 days. This information is "only" from their website. I expose their efforts to hide the actual breakthrough information by them using incredibly convoluted statistical practices. These people have to be incredibly dishonest since they are professional epidemiologists trained in statistics! I just wonder what is in it for them to do this?
This is what Keith Grellner | Administrator | Kitsap Public Health Board Executive Secretary says about his crack staff. When I quizzed him on how they present statistics. He basically gave me a lecture on "per 100.000" evaluation.
"First, the Health District employs epidemiologists who are "trained" in statics and epidemiology to manage and report our data."
Sadly they prove that Mark Twain was right with his famous quote:
"There are lies, damned lies and statistics"
I do wonder with their marketing efforts, are they being paid by the State, the Fed or Big Pharma to promote the vaccine. As you go through this report you will see information that is obviously obscured to skew the data in favor of the vaccine!
The amount of the vaccinated that are getting infected, going to the hospital and dying from the virus are growing in Kitsap County! We now are required to be vaccinated to go to work. Yet, the vaccinated are getting and spreading the virus at an increased rate.
The Breakthrough Information 10-23-21
A breakthrough is a fully vaccinated person that contracts COVID!
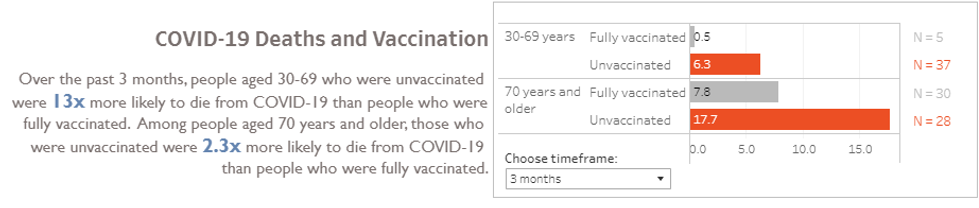
Deaths in the last 3 months
They show the actual numbers in this chart. Every chart is different.
They treat each population differently. They use a vaccinated population and an unvaccinated population.
When actually we all live in the same population which gives much different results.
I am sure they do this on purpose! Why?
Kitsap County COVID-19 Hospitalizations and Deaths
There were more vaccinated deaths 70+! Wasn't the vaccine given an FDA EUA (Emergency Use Authorization) to save those at risk? It was shocking to me to watch the marginally healthy crowd in line to get a vaccine for a virus they all would have a 99.7% rate of recovery. I am curious why they set the ages the way they did. I wonder if they would have had 50+ would we have seen even more deaths, since there are only 12 deaths under 50.
30-69 11% Vaccinated 5 Unvaccinated 37
70+ 51% Vaccinated 30 Unvaccinated 28
13x moves to 7.4x
2.3x moves to 1.1x Actually, it is now, 2.1x more likely to die if you are fully vaccinated.
Cases week ending 10-23-21
Kitsap County COVID-19 Summary Metrics
These are the breakthrough cases. Those that are fully vaccinated. Fully vaccinated is completing the vaccine requirements. Now this may be an ever changing requirement since they will be mandating the boosters as the vaccine effectiveness wanes.
As you can see there is no reason to demand proof of you being vaccinated.
You can see with the 70+ their are more cases that have been vaccinated than the unvaccinated for the second week. You can see the actual numbers are quite different from the "per 100,000" numbers! We have to look at those under 49 that have been vaccinated, I am sure they are not in the numbers of 50+.
Also vaccinated or not they become naturally immune! Which is the only way to reach herd immunity. We have to wonder what it is that leads to the vaccinated getting infected? Will the waning of the vaccine create more cases? It looks like this would prolong the virus as they again become susceptible to the virus.
Again, making us question the need for proof of vaccination.
Those fully vaccinated that are under 35 is 54%! 36+ is 64%! A significant difference as we review the following statistics.
These are the actual numbers, please go to the website, you have to hover the cursor over the number to see the actual numbers. I show the increase from the previous week.
12-29 17% +2% Vaccinated 83 Vaccinated 403
30-49 26% +9% Vaccinated 186 Vaccinated 520
50-60 43% +5% Vaccinated 182 Vaccinated 246
70+ 65% +12% Vaccinated 123 Vaccinated 67
Let's take a look at 50+. It is 49%, so we depend on those under 50 at 22% to make a difference?
50+ 49% Vaccinated 305 51% Unvaccinated 313
Just looking at this chart you would think the vaccine is really working. They are obviously trying to hide the true level of breakthrough cases.
3.6x moves to 2.2x
Total Cases
Here are the total weekly cases for week ending 10-16-21
Just compare these numbers and you have to wonder what kind of game they are playing.
Kitsap County COVID-19 Summary Metrics
Actual Numbers, again you have to hover the cursor over the numbers to see them. It really is an effort to hide the true data.
Vaccinated 110 or 28% of the cases compared to 79.1 cases
Unvaccinated 276 compared to 355.2 cases.
But 4.5 times becomes 2.5x higher. Again they are trying to hide the true breakthrough data. This is a small health department. Where do the get their marching order to manipulate the data to favor the vaccine?
Hospitalizations last month
They do not give the actual numbers. Just some obscure (per 100,000) numbers without how they got the results. I just cannot figure how they got these numbers. But as with the above examples they seem to be hiding the true data.
I have a call into Keith Grellner | Administrator | Kitsap Public Health Board Executive Secretary to get the actual numbers.
Kitsap County COVID-19 Hospitalizations and Deaths
Washington State Department of Health Kitsap County Report
We can get a more understandable and realistic look at Kitsap County overall statistics from the WSDOH website. Sadly, they do not give the breakthrough statistic. WSDOH puts the breakthrough data in a separate report that is update weekly without archival data. It is hard to get a clear representation of breakthrough data. I am sure they want it hidden.
You can select any county for statistics.
WSDOH COVID-19 Data Dashboard - Kitsap County
Kitsap County COVID-19 Dashboard
You can instantly see you are not going to get usable data by presenting it as "per 100,000" analysis. If they gave you the formula they used to get these results it may be useful. But as you can see it is not referenced on any of the data.
Why do they make you go to another page to find out there are 405 cases for that week?
What in the world are you comparing it to? It strains all credulity!