What Happened to the 2020 - 2021 Flu Season?
Here are the flu stats for 2018 -2019. Now of course the COVID stats would be higher since there was a concerted effort to do the testing. They measure these by weeks. The start of the season is the first of October and ends in June.

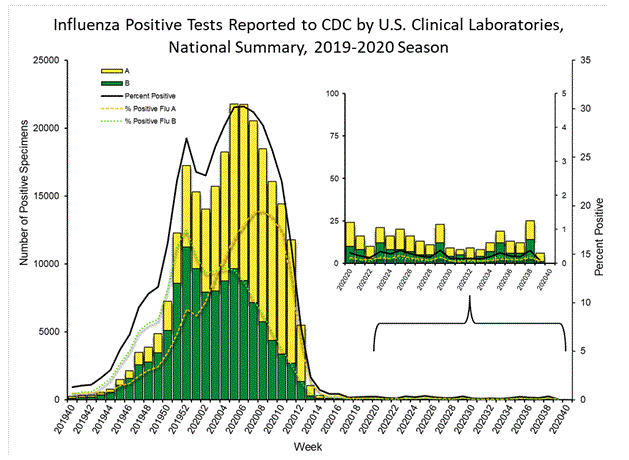
Now for 2019-2020 flu season:
You can see again it started in October but by the end of March the flu disappeared. How can that be. Well I think we all know that the flu was included in the COVID tests and has been ever since.
But this flu season was worse as you can see the reporting moved past the high of 2018 in mid-December, but really started moving in January, an increase of 37% and hitting its peak in February. It dropped away in mid-March when the COVID testing began.
I had COVID in late November. But the CDC says COVID was first seen in the US in late January. But the Red Cross found COVID in the blood supply in mid-January. (This fact has been hidden by the MSM.) The question is how long has COVID been here. When did it truly show up in China? Even today they are lying to us saying three workers in the Wuhan labs had symptoms in late November. We know that no one would question flu-like symptoms of being more than just a seasonal flu.
Study Suggests Possible New COVID-19 Timeline in the U.S.

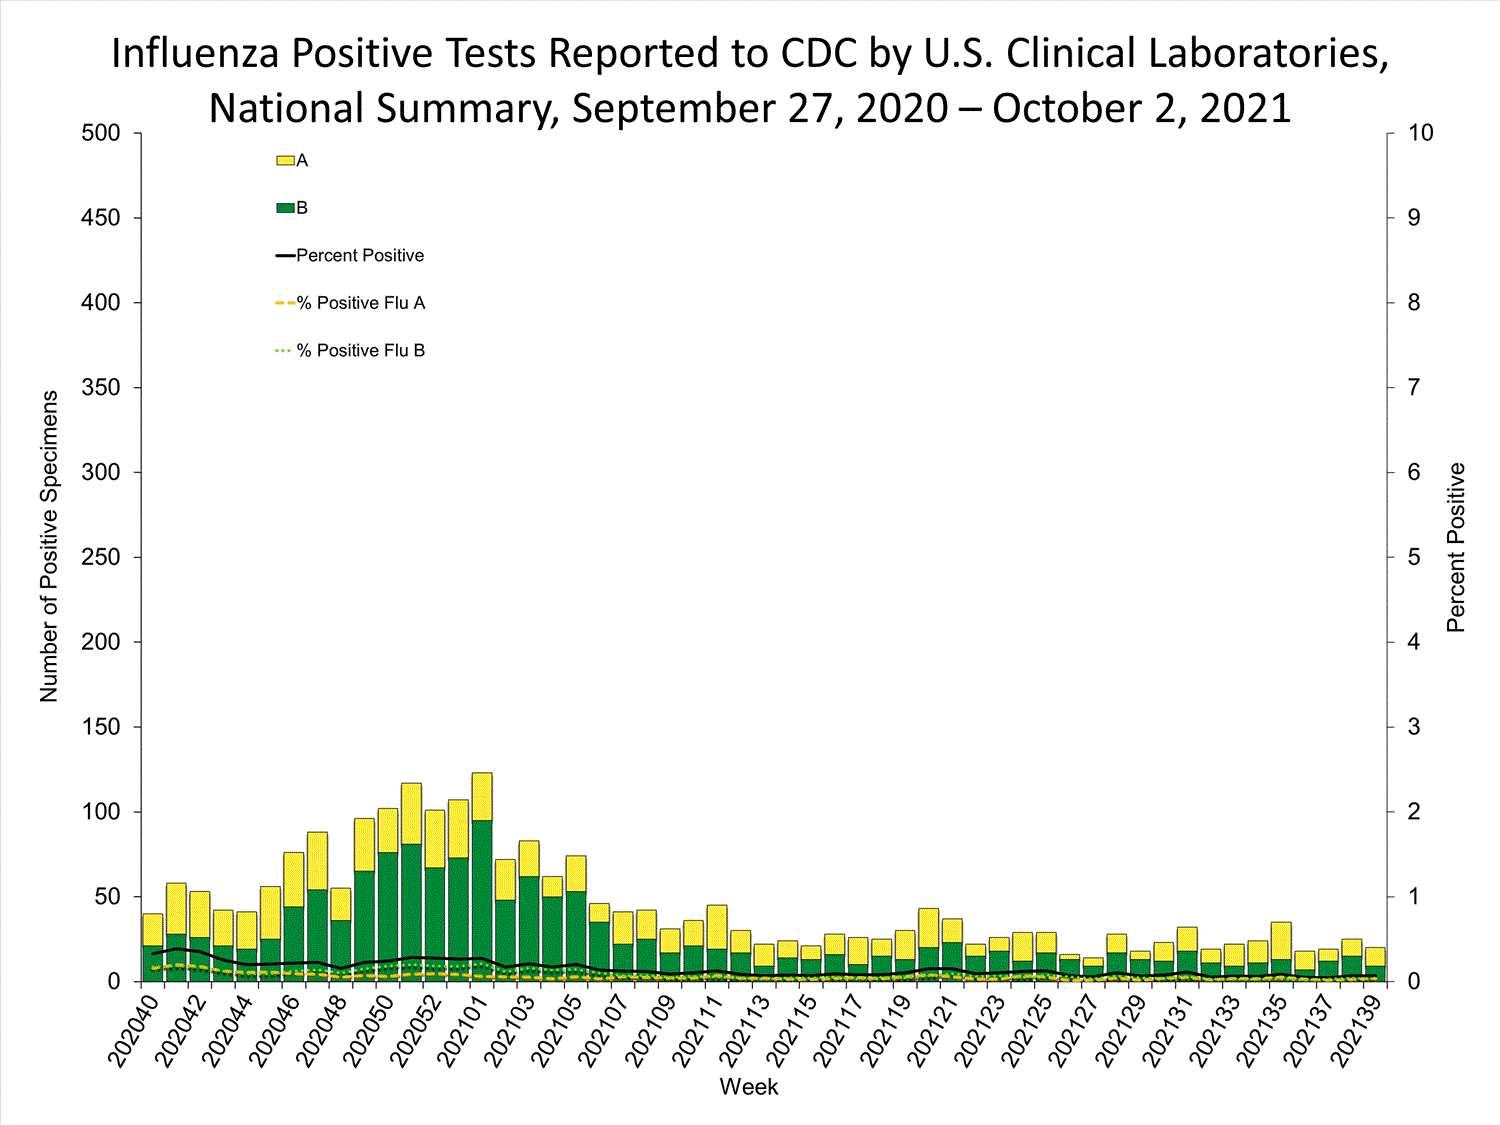
Now for the 2020-2021 COVID season to date. This must be some kind of joke, virtually no flu season. So we have to assume much of COVID was actually the flu. Remember the hospitals only made money it is was COVID.
The CDC has the Weekly U.S. Influenza Surveillance Report where you can see the past reports.
Now let's look at COVID testing. It looks low at the beginning, but the levels are in the hundreds of thousands and the flu was in the 20 thousands except this season it is in hundreds. You can see we settled into the 20 thousands in June which would have been the end of the normal flu season.
But COVID cases doubled from June to August evened out and started up in the new flu, uh COVID season. This was after the lockdowns.
Most of these were tests not cases. We have no idea how many false reads there were. But you can see COVID follows the trends of the previous years.
We now can relate a true flu season of 2018. You can see it is the same as 2020 both starting in October hitting a peak in January and February and coming to an end in June.
Now all of you know I am just some yahoo that is keeping track of the cases. Have you seen any of this type of analysis “anywhere”?
All this is observation of the obvious. I will be creating a webpage with this info. Maybe a bit more analysis. I will notify you all when it is done.
You can see that the flu or now the COVID season is starting! I wonder how the CDC will explain it!

